Saskatchewan Research Council, Air & Climate Business Unit
November 2018
Executive Summary
The ability to rapidly deploy unmanned aerial vehicle (UAV) technology for real-time assessments of site emissions could enable oil and gas companies to quickly analyze air quality, identify sources of emissions, and apply mitigation measures if/when appropriate, thereby improving both public and employee safety. The Remote Methane Leak Detector (RMLD) UAV developed by Physical Sciences Inc. (PSI) and manufactured by Heath Consultants Incorporated (Heath) serves as a platform to map path-integrated concentrations of methane in a local area, localize fugitive emissions, and estimate emission rates. The objective of this project is to test and demonstrate the practical application of the RMLD-UAV.
The primary systems that make up the package are the RMLD payload, the UAV, the ground station PC, the anemometer, and the handheld ground controller. The specific quality goals and criteria were to locate the leak source to one metre precision and detect and quantify the methane emission with 20% accuracy relative to metered leak rate for each test.
Real time data can be viewed on the ground level personal computer (PC) during the flight of the RMLDUAV. The location of the UAV and methane concentration in ppm-m is displayed on the screen. After the flight, a heat map is immediately created in which the general location of the elevated methane readings can be seen. This may be useful for operators in the field trying to quickly identify if there is a leak on site and the general area it is located. As this technology is still in development, post-processing time is required to validate the data that may take up to one week. Further processing time may be required to overlap the data onto a high resolution aerial image.
Due to less than ideal weather conditions and technical difficulties encountered during the first field test campaign in November 2017, the second field test campaign was designed to repeat the testing done in order to collect better data. Two test areas were used on the same site as the first field campaign, including an open field test area beside the site with no structures. Testing took place July 23rd to 27th, 2018. Weather conditions were favorable for flying and there were no major technical difficulties.
The test results of the second field campaign are summarized in the table below. For the tests where two leak locations were used, the location and leak rate of the larger leak is reported using current algorithms which currently cannot separate and calculate two separate leak rates. In the table of results below, the PSI Estimated Leak Rate is an estimate of the higher of the two Actual Leak Rates in a dual-leak scenario. PSI is continuing to develop and refine alternate algorithms to accurately compute the leak rates for multiple leak locations.
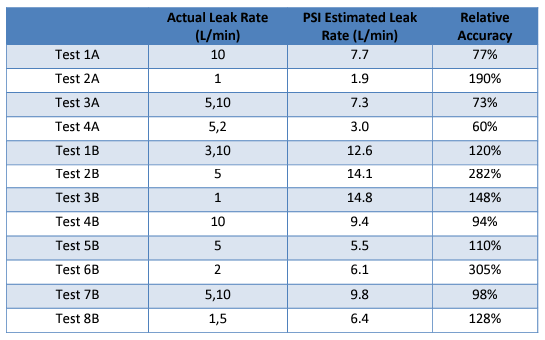
The accuracy of the leak rate estimation is significantly dependant on an accurate leak location estimation. The pool of water on site, which is highly reflective, skewed the readings high of tests 2B and 3B, where the leak location was beside the water. Other shiny surfaces may have the same effect as water on the readings. This also may be due to the accumulation of the methane over the water, contained between the berm and infrastructure.
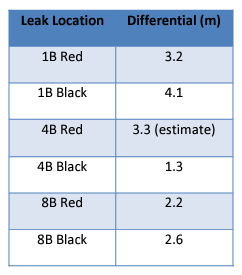
There is some concern with establishing accurate GPS or Global Navigation Satellite System (GNSS) positions with respect to methane leak detection tools. Being able to identify leaks to one metre accuracy seems to be a reasonable objective; however, obtaining this level of precision may not be practical in the real world, as seen in the results presented in the table below. This is especially true when facility structures are involved. Leak Location 4B Black had the best result at 1.3 m differential, where the operator climbed the tank ladder to get a position without interference from the tank. The precision is affected by error due to the position of the UAV as well as the tilt experienced by the UAV and methane sensor during flight. A summary of the differential in GPS position with respect to the actual leak locations for Area B is shown in the table below. Refer to Figure 13 in Section 5.0 for the relevant Leak Locations.
#16-ARPC-06 / 17-ARPC-04